Table of Contents
Summary
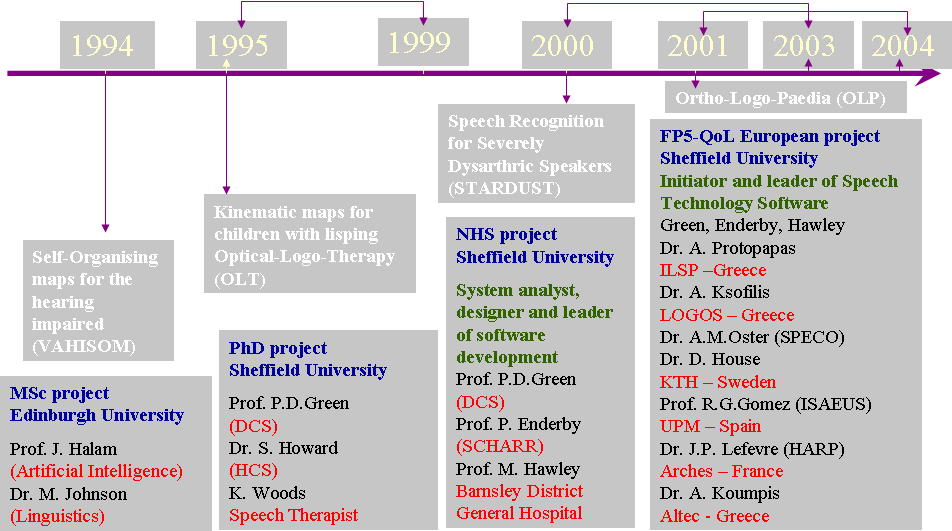
Two funded research projects: OLP FP5-Quality of Life 2.67M€ EC project and STARDUST NHS-NEAT 275K€ UK project were based on Athanassios' Optical Logo-Therapy, PhD thesis.

Past Research Projects 1994-2004
Here is a review of the OLTk software that was developed during his PhD.
PhD Thesis Summary
Optical Logo-Therapy (OLT) is about a real-time computer-based audio-visual feedback method that can used in speech training. With this method speech acoustics are transformed into visual events on a two-dimensional display called a ‘phonetic map’. Phonetic maps are created by training a neural network to associate acoustic input vectors with points in a two-dimensional space. The target points on the map can be chosen by the teacher to reflect the relationship between articulatory gestures and acoustics. OLT thus helps the client to become aware of, and to correct, errors in articulation. Phonetic maps can be tailored to different training problems, and to the needs of individual clients. We formulate the theoretical principles and practical requirements for OLT and we describe the design and implementation of a software application, OLTk. We report on the successful application of OLT in two areas: speech therapy and second language learning.
- PhD Thesis In Acrobat pdf format
OLT Therapy Sesssion
Presentations
- 1996 Insitute of Acoustics (IOA) Poster
- 1999 Phonetics Teaching & Learning Conference (PTLC) Poster
- 2001 Workshop on Innovation in Speech Processing (WISP) Poster
OLTk Introduction
OLTk provides on-line, real time audio and visual feedback of articulation by performing acoustic signal analysis. It indicates how closely a speaker’s attempt approximates to the normal or target production of specific speech. The clinician can adjust settings to provide visual and/or auditory reinforcement of the client’s attempts to correctly produce the target. OLT has also several tools that the user can easily handle to study, and examine the articulation of a certain utterance or part of it.
OLTk Speech Training Principles
-
Visuomotor tracking
-
Visual contrast
-
Visual reinforcement
OLTk Design Aspects
-
Real time audio and visual animated feedback in the form of a game
-
Qualitative and quantitative results
-
Rejection/Acceptance mechanisms to provide accurate feedback
-
Speaker comparison and trial error correction
-
Simultaneous isolated sounds and utterance training
-
Build maps based on best user training performance
-
Specialised phonetic maps tailored to the needs of the client (speech disorder, age, nationality)
-
Real time recording/playback of speech utterances and also playback of speech frames
OLTk Technical Specifications
Final Software Version Ver.3.19 – 20th September 1998
| Hardware/Software | Specifications |
|---|---|
| Machine | Toshiba Tecra 500CS with Intel Pentium 120MHz, 48MB RAM |
| Operating System | Linux 2.0.3 |
| Programming Language | GNU C++ |
| Graphics Library | EZWGL V1.39 |
| Data Types Library | LEDA 3.3.1 |
| Display Sound Files | SFS 3.0 and OGI Speech Tools |
| Sound processing | HTK V1.0 |
OLTk Interface
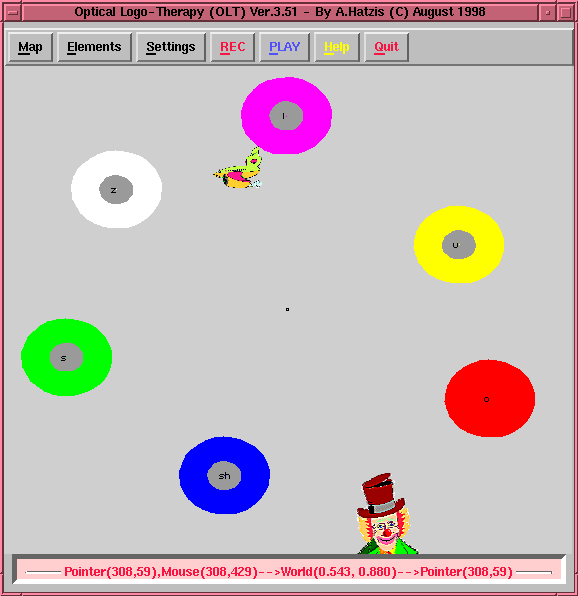
OLTk graphical user interface is split into three parts : the menu bar, the graphics canvas, and the status bar.
The phone classes and the sounds represented in the following map are:
- i (violet) as in the word see
- u (yellow) as in the word shoe
- o (red) as in the word bought
- sh (blue) as in the word shore
- s (green) as in the word suit
- z (white) as in the word zoo

OLTK GUI
Each map created consists of a number of 9D vectors. Each vector is the output of the cepstral analysis on a 10msec frame of speech. Each frame of speech is labeled according to the phone it represents. We can group phones according to the characteristic sound they represent on the basis of different place and manner of articulation. The different classes of phones can form two dimensional clusters of points depending on the method of mapping. The idea of this 2D sound mapping is to associate groups of similar sounds to neighboring areas on the map. Thus a map consists of a number of clusters and those in turn consist of a number of frames of speech each one associated with a phone label. These two groupings, the clusters and the phones, we call elements of the map and the map itself we call a phonetic map.
The above map has been created from 18 children, 9 male and 9 female, age 5-7, all English native speakers recording isolated sounds. The map has a total of 14400 samples and contains six different classes of phones, 3 vowels and 3 fricatives.
Settings
The behavior and the control of the various components of OLT and everything that is an integral part of that program depends upon the “Settings” pull down menu. All of them are in the form of radio buttons style. By pressing any of these buttons with the mouse the user can either activate or deactivate a certain feature or display or hide other essential components and control windows of OLT. The settings appear in the pull down menu as follows:
- Show Cluster Labels
- Recording/Playback Types
- Recording/Playback Parameters
- Select Samples
- Animation Types
- Activate Extracted Buffer
- Mapping Techniques
- Map Appearence
Recording/Playback Parameters
This radio button can show or hide the recording/playback parameters window. The modification of these parameters is achieved through a set of sliding bars. These include:
-
Duration: The total duration of recording in secs. The radio button existing next to the label of the parameter has to be activated in order to apply a time limit. If the radio button is not checked then you can record for unlimited time.
-
Context: The context width or the number of frames ahead and behind a certain frame. One frame is equal to 10msec. This is used in conjuction with the Playback Frames Sequence tool to define the limits of the part of the utterance to be extracted.
-
Averaging: Average the 2D positions every N number of frames. Set a relatively high value when trying isolated sounds and a relatively low value when trying small utterances. The higher the value the less the flickering and the smoother the animation of sprites.
-
Threshold: Value to determine whether to accept or reject a certain frame of speech. The higher it is, the more similar a new sound should be with those that make up the phonetic map in order to be accepted. On the contrary, if we lower the threshold slide bar the less strict we become on the acceptance of a sound. The higher is the value the more it rejects the less it accepts, the lower is the value the more it accepts the less it rejects. This parameter is used in conjuction with the “-Threshold” field of the cluster information to tune the threshold of the specific phone cluster according to our needs.
Parameters like “Averaging” and “Threshold” have been designed to work interactively with the “Real Time” recording and playback.
Animation Types
These radio buttons define the various types of animation that are used to represent the appropriate visual feedback:
-
Animate Sprite: This is the default setting for the animation type. A plane sprite is flying to positions that are related with specific sounds. If the sound produced is quite dissimilar of those existing on our phonetic map the plane disappears from the screen and the frowning of a clown’s face is used to indicate the rejection. In case of acceptance the plane is flying and the clown appears with a happy face. Silence state is also represented with a different plane image that shows it sleeping.
-
Draw Points: If we activate that type of animation we can see the exact 2D positions for each frame of speech or for the average during our speech production. The hits are represented with black filled rectrangles.
-
Draw Trajectory: This is the third type of animation we can select. A visual feedback representation of the sound can be obtained by plotting with filled rectangles and connecting with a line the 2D positions of successive speech frames. As new sounds are produced the old positions are deleted and the new positions are appended. This gives the impression of a moving snake.
Mapping Techniques
These are the techniques we developed for the mapping of the sounds from 9D to 2D:
-
ND TO 2D: A neural network (NN) has been trained to map all the frames of a particular sound to a certain fixed 2D position on our phonetic map. Similar sounds with those that our NN has been trained with are mapped to neighbooring positions.
-
Central Force: The classification results of a speech frame for each one of the phone classes together with the 2D distances from the fixed centroids of each phone cluster are used to determine the 2D position of the speech frame on the map.
